How satellites, algorithms and AI can help map and trace methane sources


Every year, our planet gets hotter because of greenhouse gas pollution. In fact, 2023 was the hottest year on record, and the last ten years have been the hottest years since 1850. Reducing this warming is essential to decreasing the risk of wildfires, drought and other extreme environmental events, and results in cleaner air and healthier communities. Today, we’re announcing a partnership with Environmental Defense Fund (EDF) that combines our science and technology to reduce methane emissions. This is one of the most powerful, short-term actions we can take to reduce warming.
Methane from human sources is responsible for about 30% of global warming today, and a big contributor of methane in the atmosphere comes from extracting fossil fuels, like oil and gas, from the Earth. By powering methane detection algorithms with Cloud computing and applying AI to satellite imagery to identify oil and gas infrastructure around the world, our goal is to help EDF quantify and trace methane emissions to their source. With this information, energy companies, researchers and the public sector can take action to reduce emissions from oil and gas infrastructure faster and more effectively.
How satellites will help us spot methane from space
EDF’s new satellite, MethaneSAT, will map, measure and track methane with unprecedented precision, offering a comprehensive view of methane emissions. Launching in early March on a SpaceX Falcon 9 rocket, MethaneSAT will orbit the Earth 15 times a day at an altitude of over 350 miles. It will measure methane levels in the top oil and gas regions in the world for regular analysis. MethaneSAT is highly sophisticated; it has a unique ability to monitor both high-emitting methane sources and small sources spread over a wide area. To calculate the amount of methane emitted in specific places and track those emissions over time, EDF developed algorithms powered by Google Cloud in collaboration with scientists at Harvard University's School of Engineering and Applied Science and its Center for Astrophysics, and scientists at the Smithsonian Astrophysical Observatory.
EDF’s aerial data, available in Earth Engine, shows both high-emitting point sources as yellow dots, and diffuse area sources as a purple and yellow heat map. MethaneSAT will collect this data with the same technology, at a global scale and with more frequency.
Mapping methane leaks
In addition to detecting emissions, we’re taking it a step further and creating a global map of oil and gas infrastructure, with the goal of understanding which components contribute most to emissions. Just like how we use AI to detect sidewalks, street signs and road names in satellite imagery to display helpful information in Google Maps, we’ll also use AI to identify oil and gas infrastructure, like oil storage containers, in our imagery. Then, we’ll combine it with EDF’s information about oil and gas infrastructure to locate where the emissions are coming from.
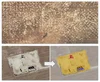
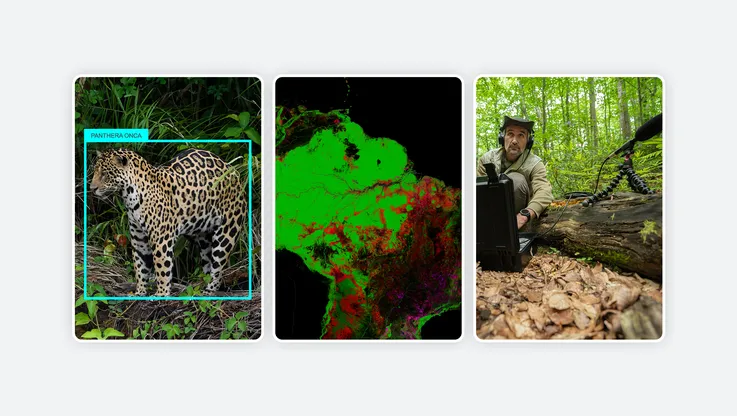
The top satellite image shows a map of dots, which are correctly identified as oil well pads. Using our satellite and aerial imagery, we applied AI to detect infrastructure components. Well pads are shown in yellow, oil pump jacks are shown in red, and storage tanks are shown in blue.
Once we have this complete infrastructure map, we can overlay the MethaneSAT data that shows where methane is coming from. When the two maps are lined up, we can see how emissions correspond to specific infrastructure and obtain a far better understanding of the types of sources that generally contribute most to methane leaks. This information is incredibly valuable to anticipate and mitigate emissions in oil and gas infrastructure that is generally most susceptible to leaks.
How companies can use this information to take action
To help researchers and organizations, these insights will be available later this year on MethaneSAT’s website and accessible through Google Earth Engine, our planetary-scale environmental monitoring platform. By making MethaneSAT datasets available on Earth Engine, which has over 100,000 monthly active users, it’s easier for users to detect trends and understand correlations between human activities and environmental impact. For example, Earth Engine users can combine methane data with other datasets — like land cover, forests, water, ecosystems, regional borders and more — to do things like track methane emissions in a given area over time. Explore the aerial data or access it for analysis in Earth Engine.
Earth Engine users can combine methane data with other datasets.
Figuring out how to address methane emissions is one of the biggest climate challenges we face today. We’re excited to share actionable information that is urgently needed to achieve real impact. This work is possible thanks to our partners at EDF.